|
Interpreting
and explaining the
H-1 hydrogen-1 (proton) NMR spectrum of ethene
(ethylene)
[Author
©
Dr Phil Brown PhD:
Doc Brown's advanced level organic chemistry exam revision notes
suitable for students of UK A level chemistry courses & US K12 grade
11, grade 12 and AP honors chemistry courses: Molecular
spectroscopy - analysing the 1H NMR spectra of ethene
[spectra
page updated
April 3rd 2026 *]
email doc brown
Re-edit 1H
NMR spectrum of
CH2=CH2
Links associated with ethene
* [privacy policy, cookies
and disclaimer]
This is a BIG chemistry website, PLEASE take time to explore it
H-1 proton NMR spectroscopy -
spectra index
See also
comparing the infrared, mass, 1H NMR and 13C NMR spectra of ethane and
ethene
Introductory note on the 1H NMR spectra of ethene
Students and teachers please note my explanation of the
proton NMR spectrum of ethene is designed for advanced, but
pre-university, chemistry courses.
The chemical shift
δ splitting pattern effects for
ethene are
confined to a proton spin-spin
coupling effects analysed using the n+1 rule for adjacent
non-equivalent proton fields (n is the number of neighbouring
protons in a non-equivalent different chemical environment for the
ethene molecule).
It is assumed that the integrated intensities of the
δ
chemical shifts give the ratio of the protons in the different
non-equivalent chemical environments of the ethene molecule.
The most common solvent used for investigating the 1H NMR
spectrum of compounds like ethene, is CDCl3 and other
deuterated solvents to avoid confusion with a 1H NMR
signal, 2D (2H) has a different chemical
shift.

TMS is the acronym for tetramethylsilane, formula Si(CH3)4,
whose protons are arbitrarily given a chemical shift of 0.0 ppm.
This is the 'standard' in 1H NMR spectroscopy and all
other proton resonances, called chemical shifts, are measured
with respect to the TMS, and depend on the
individual (electronic) chemical environment of the hydrogen atoms
in an organic molecule - ethene here.
The chemical shifts quoted in ppm on the diagram of
the H-1 NMR spectrum of ethene represent the peaks of the intensity of
the chemical shifts of (which are often groups of split lines at
high resolution) AND the relative integrated areas under the peaks
gives you the ratio of protons in the different chemical
environments of the ethene molecule.
Ethene
C2H4
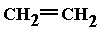 displayed formula of ethene displayed formula of ethene
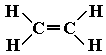 skeletal formula is only skeletal formula is only

The molecular structure and naming of alkenes
Interpreting the
H-1 NMR spectrum of
ethene
In terms of spin-spin coupling from the possible proton magnetic
orientations, for ethene, no such interactions can take place due to the
symmetry of the molecule.
The 4 hydrogen atoms (protons) of ethene occupy
the same chemical environment so that the high or low resolution NMR
spectra only shows one principal
1H singlet peak for one H-1 NMR chemical shift
only. (diagram above for
ethene).
CH2=CH2
Chemical shift
(a) 5.25 ppm on the H-1 NMR
spectrum diagram for ethene.
Although there are 4 hydrogen atoms in the molecule,
there is only one possible chemical
environment for the 4 hydrogen atoms in the symmetrical ethene molecule.
So, there is no need to apply the
n+1 rule
to ethene because all the protons are
equivalent to each other
and therefore cannot cause splitting of their common single
resonance line.
The splitting pattern from proton
spin-spin coupling effects is analysed using the n+1 rule for
adjacent non-equivalent proton fields (n is the number of
neighbouring protons in a non-equivalent different chemical
environment) and applied to the 1H NMR spectrum of
ethene.
|
Number of directly adjacent protons 1H
causing splitting |
Splitting pattern produced from the
n+1 rule on spin-spin coupling and the theoretical ratio of line intensities |
|
0
means no splitting |
|
|
|
|
|
|
1 |
|
|
|
|
|
|
|
1
creates a doublet |
|
|
|
|
|
1 |
|
1 |
|
|
|
|
|
|
2
creates a triplet |
|
|
|
|
1 |
|
2 |
|
1 |
|
|
|
|
|
3
creates a quartet |
|
|
|
1 |
|
3 |
|
3 |
|
1 |
|
|
|
|
4
creates a quintet |
|
|
1 |
|
4 |
|
6 |
|
4 |
|
1 |
|
|
|
5
creates a sextet |
|
1 |
|
5 |
|
10 |
|
10 |
|
5 |
|
1 |
|
|
6
creates a septet |
1 |
|
6 |
|
15 |
|
20 |
|
15 |
|
6 |
|
1 |
|
Comparing the infrared, mass, 1H NMR and 13C NMR
spectra of
ethane and ethene
NOTE: The images are linked to their
original detailed spectral analysis pages AND can be doubled in
size with touch screens to
increase the definition to the original ethane and
ethene image sizes. |
 |
 |
|
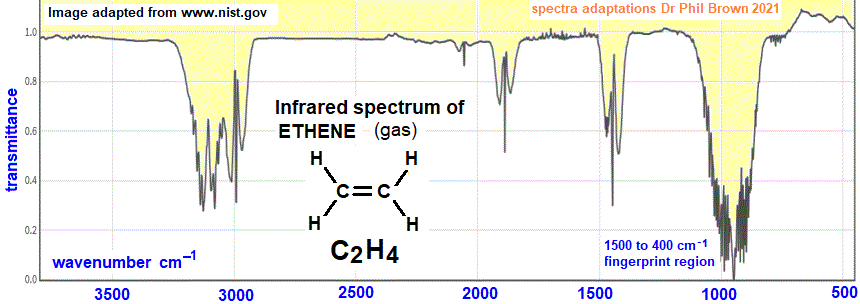
INFRARED SPECTRA:
Apart from the significant differences in the fingerprint region at
wavenumbers 1500 to 400 cm-1, the most striking
differences are (i) the band at ~1900 cm-1 for ethene,
absent in the ethane spectrum, (ii) the bands at 800 cm-1
for ethane (CH3 vibrations), absent or much weaker in
ethene, and (iii) the strong absorptions at ~1000 cm-1
for ethene, completely absent in the ethane spectrum. |
 |
 |
|
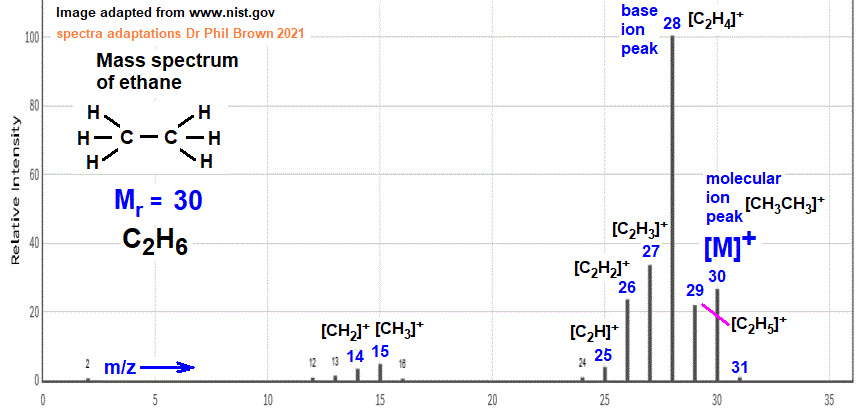
MASS SPECTRA: Both
ethane and ethene show some similarities in their mass
spectra e.g. m/z ions 25 to 28 for [C2Hx]+
(x = 1 to 4) ions and in both cases the base ion peak has an m/z
of 28. However, the molecular ion peaks will be different
because of their different relative molecular masses i.e. ethane
m/z 30 and ethene m/z 28. Ethane also has a prominent m/z ion
peak of 29, which is tiny in the ethene mass spectrum (and only
due to 1% 13C atoms in the parent molecular ion). |
 |
|
|
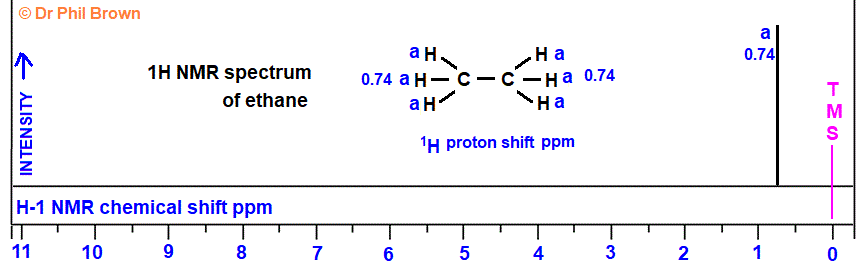
1H NMR SPECTRA: The 1H NMR spectra of
ethane and ethene are similar in that that both give one single
singlet resonance line in their proton NMR spectra. All the
protons in each molecule are equivalent to each other and occupy
the same chemical environment due to the symmetry of the
molecule, so no resonance splitting. However the two 1H
chemical shifts are significantly different due the different
shielding effects of the -CH3 and =CH2
groupings respectively. Ethene has a much greater 1H
NMR chemical shift. |
 |
 |
|
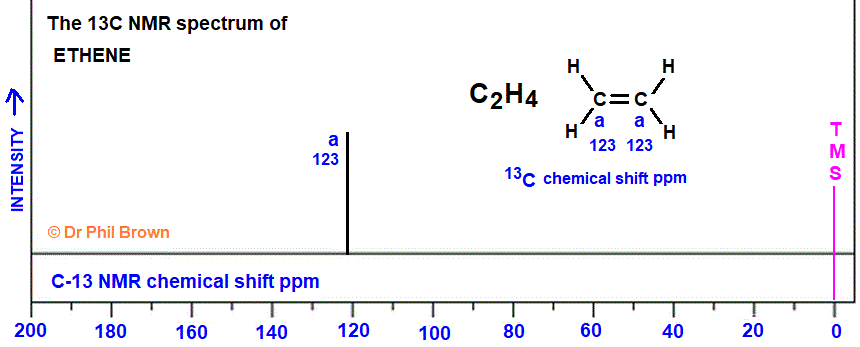
13C NMR SPECTRA: The
1C NMR spectra of ethane and ethene are similar in that that
both give one single resonance line in their carbon-13 NMR
spectra. In both molecules the two carbon atoms occupy the same
chemical environment due to the symmetry of the molecule.
However the two 13C chemical shifts are significantly
different due the different shielding effects of the -CH3
and =CH2
groupings respectively. |
Key words & phrases:
C2H4
CH2=CH2 Interpreting the proton H-1 NMR spectra of ethene, low resolution & high resolution proton
nmr spectra of ethene, H-1 nmr spectrum of ethene, understanding the
hydrogen-1 nmr spectrum of ethene, explaining the line splitting patterns from
spin-spin coupling in the
high resolution H-1 nmr spectra of ethene, revising the H-1 nmr spectrum of
ethene,
proton nmr of ethene, ppm chemical shifts of the H-1 nmr spectrum of ethene,
explaining and analyzing spin spin line splitting in the H-1 nmr spectrum, how
to construct the diagram of the H-1 nmr spectrum of ethene, how to work out the
number of chemically different protons in the structure of the ethene organic
molecule, how to analyse the chemical shifts in the hydrogen-1 H-1 proton NMR
spectrum of ethene using the n+1 rule to explain the spin - spin coupling ine
splitting in the proton nmr spectrum of ethene deducing the nature of the protons
from the chemical shifts ppm in the H-1 nmr spectrum of ethene
examining the 1H nmr spectrum of ethene analysing the 1-H nmr spectrum of
ethene
how do you sketch and interpret the H-1 NMR spectrum of ethene interpreting
interpretation of the 1H proton spin-spin coupling causing line splitting in the
NMR spectrum of ethene
assignment of chemical shifts in the
proton 1H NMR spectrum of ethene formula explaining spin-spin coupling for line
splitting for ethene ethylene alkene
functional group
How do you interpret the H-1 NMR spectrum of
ethene How to interpret
the H-1 NMR spectrum of ethene Explanatory diagram of the chemical
shifts of the 1H H-1 proton NMR spectrum of the ethene
molecule in terms of its molecular structure. Listing data of all the chemical shift peaks in ppm in the
proton NMR spectrum of ethene. How to explain the H-1 NMR spectrum of
ethene. The chemical shifts and integrated values of the proton ratios in the 1-H NMR
spectrum of the ethene molecule. How to work out the molecular
structure of the ethene molecule from its proton NMR spectrum. The uses
and distinctive features of the proton NMR spectrum of the ethene
molecule explained. What does the H-1 proton NMR spectrum chemical
shifts tell us about the
structure and properties of the ethene
molecule? explaining the spin-spin proton coupling effects in the 1H
NMR spectrum of ethene. interpretation
diagram explaining the proton splitting pattern produced from the
n+1 rule and the theoretical ratio of chemical shift
δ and values of
intensities for the proton NMR spectrum lines of ethene
Links associated
with
ethene
The chemistry of ALKENES
revision notes INDEX
The infrared spectrum of ethene ('ethylene')
The mass spectrum of ethene ('ethylene')
The C-13 NMR spectrum of ethene ('ethylene')
H-1 proton NMR spectroscopy index
(Please
read 8 points at the top of the 1H NMR index page)
ALL SPECTROSCOPY INDEXES
All Advanced Organic
Chemistry Notes
Use My Google search site box
Email doc b:
chem55555@hotmail.com
Website content © Dr
Phil Brown 2000+. All copyrights reserved on revision notes, images,
quizzes, worksheets etc. Copying of Doc Brown's pre-university
advanced level chemistry website material is NOT
permitted. Exam revision summaries & references to science course specifications
are unofficial. These organic chemistry revision notes on
spectroscopy (1H NMR spectra of ethene) are
suitable for use of pre-university students studying AQA advanced level
chemistry, Edexcel advanced level chemistry, OCR advanced level
chemistry, IB advanced level chemistry, WJEC (Eduqas) advanced level
chemistry, CIE advanced level chemistry, CCEA advanced level chemistry, US grade 11-12 AP honors
chemistry courses and they will also prove useful to
1st year undergraduate students of chemistry. |
 ENTER
chemistry words e.g. topic, module, exam board,
formula, compound, reaction, structure, concept, equation, any 'phrase',
homework question! anything of chemical interest, like your latest homework question!
or anything
of scientific interest! This is a very comprehensive Google
generated search of my website.
ENTER
chemistry words e.g. topic, module, exam board,
formula, compound, reaction, structure, concept, equation, any 'phrase',
homework question! anything of chemical interest, like your latest homework question!
or anything
of scientific interest! This is a very comprehensive Google
generated search of my website.